Search for an answer or browse help topics

You can view charts by using Shortcut: Shift + C. To load a chart, click the chart button on the Market Watch toolbar or can use the shortcut key or by right-clicking on a selected scrip and click on Chart.
Note: Intraday Charts can also be open by double-clicking on charts columns for particular scrip.
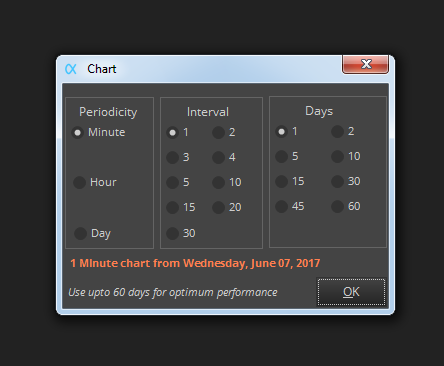
A chart settings screen will display. Here the user will select Periodicity, Interval, and no. of Days/Months for the selected scrip. Click the OK button to load the chart. By default, the selected Symbol in the MarketWatch tab is populated. For optimum performance, always use up to 60 days for optimum performance.

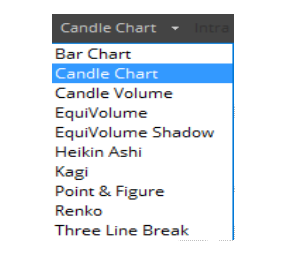
By default, a two-dimensional candle chart will display. Users may change the candle style to other chart styles listed in the Price Style drop-down menu in the advanced chart toolbar.

Technical indicators may be added to the chart via the Study menu in the advanced chart toolbar. Simply search for a technical indicator in the study menu or select any indicator by scrolling through the given list of technical indicators in the Study menu and then click on it or press enter.
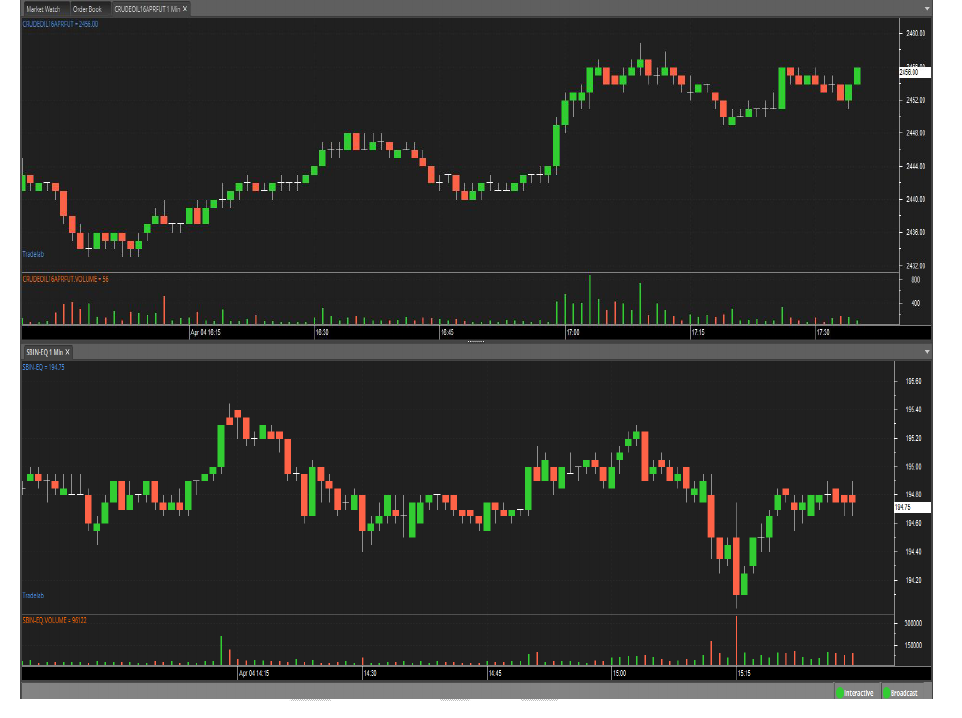
If multiple charts are shown on the same screen, a selection border will be drawn around the selected chart. It can see in the image below, a blue selection border has been drawn around the lower chart area, which is currently selected. The selection border drawn around the selected chart can be decided according to the Dark themes. For the Dark theme, the selection border color is white.

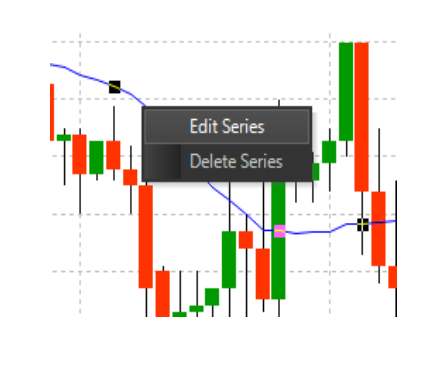
Once a technical indicator has been added to the chart from the Study menu, the user may edit the indicator’s properties by first left-clicking on the indicator or by double-clicking on the indicator, then right-clicking and selecting “Edit Series”. The indicator property dialog will display, where the user can change indicator parameters and colors.

Users can drag and drop series from one area of the chart to another. To do so, select a series and then drag it to another area (such as on top of the price bars).

Users can also resize chart panels. Simply click near the borders and drag the panel either up or down. To navigate the chart, click the zoom in, zoom out, scroll left, and scroll right buttons located on the chart toolbar.
Note: a chart can only be scrolled after the user zoomed in to a certain degree.

Main Menu

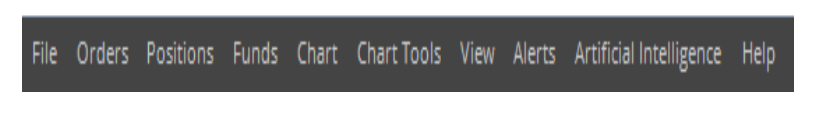
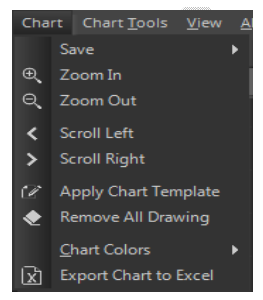
Chart Menu

Loading of charts could be accessed from the file menu in the Main menu.
Note: If the internet connection is not stable or disconnecting frequently, candles in the saved charts will be missing or there will be some missing data in Charts loaded from disk.
Charts can be saved and loaded back into Alpha Trader using the Load Chart from the Disk menu in File Menu. Save Chart saves the file on the Disk. Save Chart as image saves the charts as snapshots. Also, Chart Template could be saved for later applying on charts to do a similar technical study on all the charts.
Zoom-in the selected chart.
Zoom-out the selected chart.
To navigate through the chart, scroll left.
To navigate through the chart, scroll right.
User can apply his/her favorite indicators and colors at once.
Alpha Trader also allows users to apply templates to charts so that user favorite indicators and colors can be applied at once. Simply click the “Apply Template” button on the toolbar or select the template of his/her choice.
Note: the chart must have a volume series in order for this feature to work.
Users can remove all the drawing objects in one click from the selected chart.
Delete All Drawings button can remove all the drawing objects in one click from the selected chart. Trend lines, Gann fans, Error channels, and other line studies can be added via the “Chart Tools” menu in the main menu or from the advanced chart toolbar. Drawings can be saved in the Save Chart as a template.
Note: Drawings can be applied to the same positions (or data points) where the drawings were drawn, in case data points are not found, drawings may not be drawn.
Chart Color allows user to choose a color for:
All values on a chart may be exported to Excel. Simply click a chart to select it then click the Export Chart to Excel in the Chart menu.
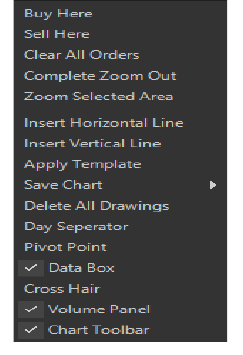


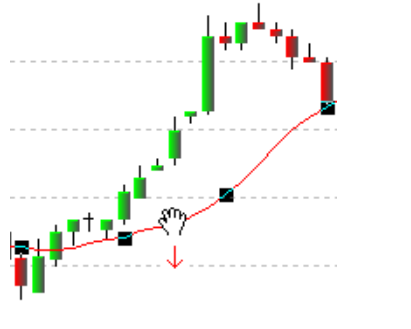
Users can also add buy, sell, exit symbols, text objects, and other objects via the “Chart Tools” menu or from the advanced chart toolbar. These objects may be placed anywhere on the chart and may be repositioned or removed by a left click.
Important Features in Charts :

Simply fill the details, connect your bank account & upload your documents.
Open An AccountYou will be redirected in a few seconds.